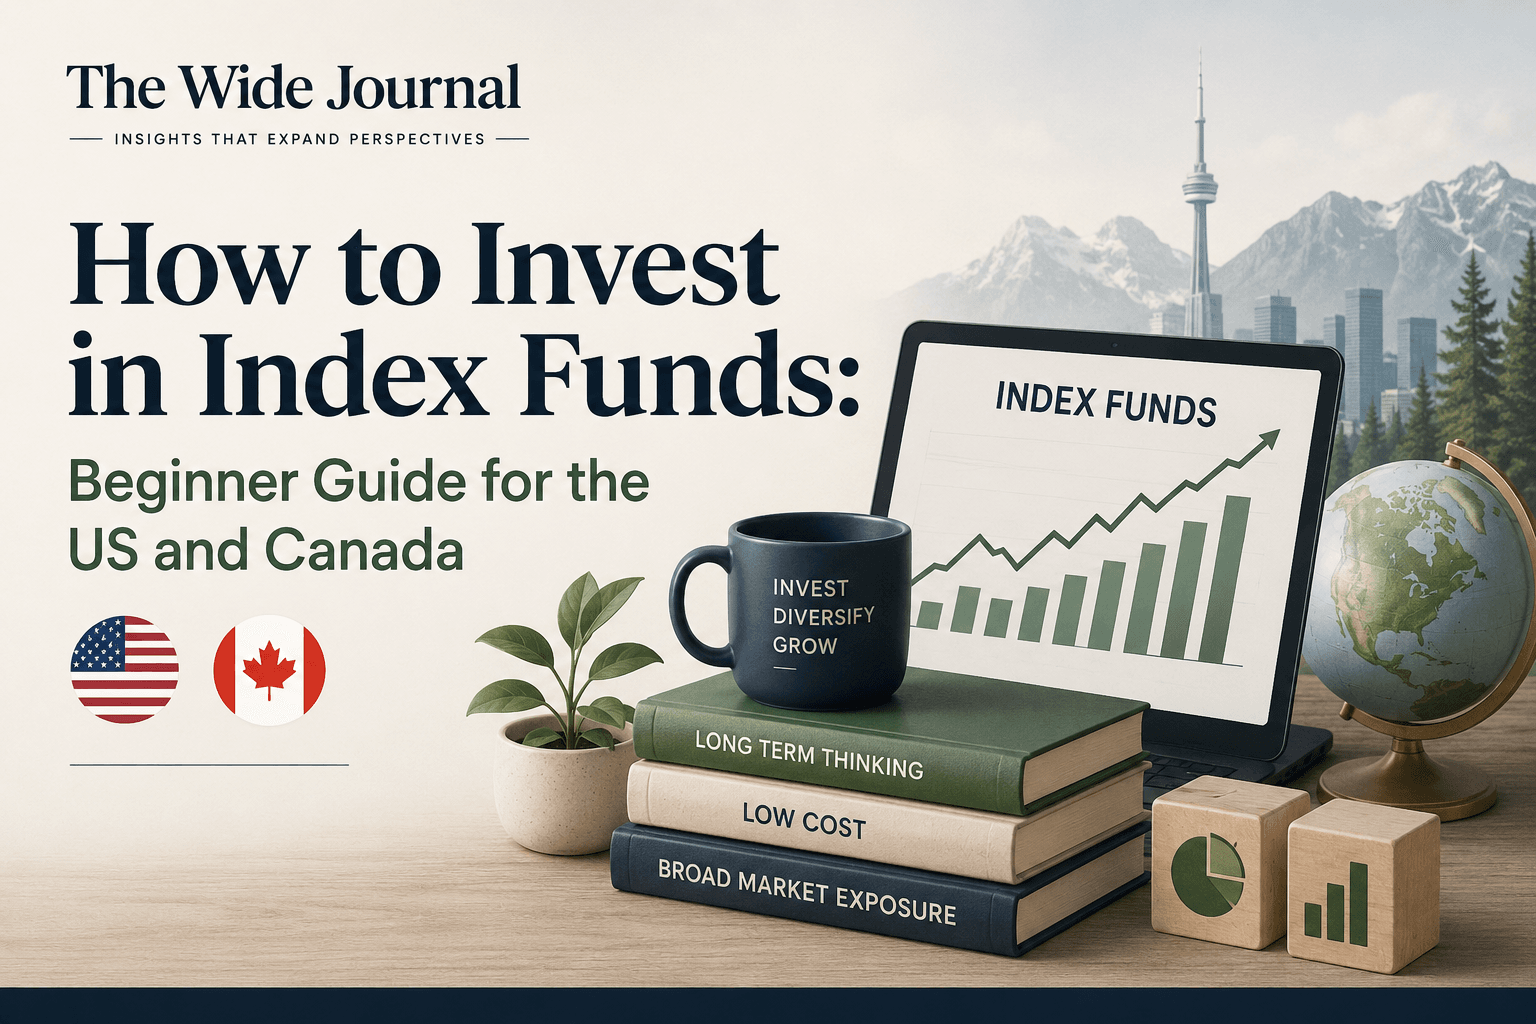
Over the past decade, the S&P 500 has quietly transformed from a broadly diversified index into one increasingly dominated by a handful of mega-cap technology companies. For the millions of investors who hold index funds as the core of their portfolios, S&P 500 concentration risk has become a topic that can no longer be overlooked. Whether you’re reviewing your retirement savings or exploring broader investing guides and analysis, understanding how concentrated the index has become — and what that means for your risk exposure — is essential context for 2026. This article draws on verified institutional research and live market data to walk through the current state of concentration, the mechanisms that drive it, and the diversification strategies some investors consider in response. For more context on related topics, explore our Finance articles covering markets and portfolio strategy.
How Concentrated Has the S&P 500 Become?
As of early 2026, the top 10 holdings in the S&P 500 account for roughly 40% of the entire index’s weight — a level that research suggests is nearly double what it was in 2015, raising questions about what “diversification” in a cap-weighted index actually means today.
The numbers are striking when placed in historical context. RBC Wealth Management’s analysis using FactSet data, as of December 31, 2025, found the top 10 S&P 500 companies holding 40.7% of total index weight — nearly double their share from 2015.
The Herfindahl-Hirschman Index (HHI), a standard measure of market concentration, stood at 185 against a five-year average of 142 on the S&P Global Index — a meaningful deviation from recent norms. The effective number of stocks driving index returns (“effective N”) was measured at just 54, meaning that despite the index holding 500 companies, the return profile behaved more like a portfolio of roughly 54 equally weighted positions. The technology sector alone comprised 31.2% of the cap-weighted index versus only 9.1% in an equal-weighted version of the same index.
What Is the Magnificent Seven Portfolio Risk in 2026?
The so-called Magnificent Seven — a cohort of mega-cap technology and technology-adjacent companies — sat at approximately 30.44% of the S&P 500’s total weight as of the AhaSignals April 2026 reading, with other estimates from 24/7 Wall St.’s May 2026 analysis citing a range of 35–40% depending on methodology and date. This concentration creates a specific category of risk: when a small cluster of stocks shares correlated business exposures — to AI infrastructure spending, digital advertising, cloud computing, and semiconductor supply chains — a single adverse macro development could affect multiple holdings simultaneously.
The semiconductor dimension compounds this. According to the 24/7 Wall St. analysis citing Bespoke Investment Group data, semiconductor stocks accounted for approximately 23% of S&P 500 market capitalization, with the PHLX Semiconductor Index having risen 146% over two years compared to the S&P 500’s 43% gain. That kind of sectoral outperformance, while beneficial during the rally, also embeds elevated reversal risk into any cap-weighted index position.
According to RBC Wealth Management’s research (using FactSet data as of December 31, 2025), the top 10 S&P 500 companies hold 41% of index weight while contributing only 32% of index earnings — a gap that the firm identifies as a structural vulnerability it calls “AI correlation risk,” alongside idiosyncratic shock risk and what it terms the “passive concentration trap.”
Is the Weight-to-Earnings Gap a Warning Signal?
A key concern researchers highlight is that mega-cap valuations may not be fully supported by their proportional share of earnings — meaning investors in cap-weighted index funds may be paying a premium for concentration that earnings alone do not yet justify.
Lord Abbett’s institutional research, published in February 2026 with data as of December 31, 2025, noted that the S&P 500’s top 10 holdings represented approximately 40% of total index weight. Their analysis also tracked a notable shift in earnings dynamics: the Magnificent Seven’s share of S&P 500 earnings growth declined sharply from 225% in Q4 2023 to 31% by Q3 2025, suggesting that while these companies remain large, their dominance as the sole driver of index-level earnings growth may be moderating.
Guinness Global Investors’ research (October 2025, using Bloomberg data through August 2025) provided longer-term context: top 10 S&P 500 concentration roughly doubled from around 20% in 2015–2016 to 40% by their measurement period. On an earnings basis, top 10 EBIT concentration rose from 20% to 30%, and forward net income share reached approximately 34% — a gap below the 40% weight figure. Guinness also contextualized current concentration against two prior peaks: the dot-com bubble and the period surrounding the Global Financial Crisis.
According to Guinness Global Investors’ research report (October 2025, Bloomberg data through August 2025), current S&P 500 concentration levels — with the top 10 companies at approximately 40% of index weight — are historically elevated and comparable in some respects to concentration patterns observed during the dot-com bubble, though the underlying earnings and profitability characteristics of today’s mega-caps differ from that era’s largely unprofitable tech cohort.
S&P 500 Diversification Strategies: What Are Investors Considering?
Some investors and advisors have explored strategies aimed at reducing dependence on cap-weighted mega-cap exposure, ranging from equal-weight index funds to international equity allocations and factor-based approaches — each carrying its own trade-offs.
Equal-Weight Indexing as an Alternative
One approach some investors consider is equal-weight S&P 500 index exposure, where each of the 500 companies receives the same allocation regardless of market capitalization. RBC Wealth Management’s analysis included charts comparing equal-weight versus cap-weight performance across different market environments, illustrating that performance leadership between the two approaches has historically rotated. Equal-weight strategies may underperform during periods of mega-cap dominance but may offer broader participation when market leadership widens.
International and Geographic Diversification
Another approach involves increasing allocation to non-U.S. equities. Valuations in international developed markets and emerging markets have historically traded at discounts to U.S. large-cap equities, though currency risk, geopolitical risk, and differing regulatory environments introduce distinct risk factors. Some financial planning frameworks suggest that over-concentration in any single country’s equity market — including the U.S. — may itself represent a form of concentration risk.
Sector and Factor Tilts
Factor-based strategies — such as value, small-cap, or low-volatility tilts — have historically provided return streams with lower correlation to mega-cap growth stocks in some market environments. These approaches do not eliminate risk and may underperform growth-oriented strategies during extended technology bull markets, but some investors consider them as a potential offset to heavy S&P 500 mega-cap exposure.
Concentration Risk by the Numbers: A Comparison Table
| Metric | Current Level (2025–2026) | Historical Baseline / Comparison | Source |
|---|---|---|---|
| Top 10 S&P 500 Weight | ~40–40.7% (cap-weighted) | ~20% in 2015–2016 (approx. double) | RBC Wealth Management / Guinness GI |
| Magnificent Seven Index Weight | ~30.44% (SPY-derived, April 2026) | 35–40% cited in broader estimates | AhaSignals / 24/7 Wall St. |
| HHI Concentration Score (SPY) | 185 (April 2026) | 5-year average: 142 | AhaSignals |
| ACRI Composite Concentration Score | 81/100 — CRITICAL | No prior CRITICAL-level reading noted | AhaSignals |
| Technology Sector Weight (cap-weighted vs. equal-weight) | 31.2% cap-weighted vs. 9.1% equal-weighted | Reflects structural bias of cap-weighting methodology | AhaSignals |
| Top 10 Earnings Share vs. Weight Gap | 41% weight vs. 32% earnings contribution | Historically weight and earnings share have been closer | RBC Wealth Management |
| Mag 7 Share of S&P 500 Earnings Growth | 31% in Q3 2025 | 225% in Q4 2023 (peak dominance) | Lord Abbett |
Does High Concentration Necessarily Mean Imminent Risk?
While concentration metrics are at historically elevated levels, some researchers argue that today’s mega-caps differ meaningfully from prior bubble-era companies — pointing to profitability, cash generation, and structural market positions as potentially justifying premium valuations.
Alternative Perspectives
The concentration risk debate is not one-sided. Critics of the “concentration equals danger” framing point out that the current cohort of mega-cap companies — unlike many dot-com era firms — are generally highly profitable, with significant free cash flow, dominant market positions, and diversified revenue streams across hardware, software, cloud services, and advertising. Lord Abbett’s research highlighted that Magnificent Seven earnings growth leadership, while declining from its 2023 peak, still represented a meaningful contribution to index-level growth as of Q3 2025. Some analysts argue that market-cap weighting is, by definition, a reflection of collective investor judgment about relative value — and that structural concentration may persist as long as earnings growth and competitive moats support premium valuations. On the other side, researchers including those at RBC Wealth Management and Guinness Global Investors caution that elevated weight-to-earnings gaps, passive investing feedback loops that mechanically amplify concentration, and correlated AI-related exposures across multiple mega-caps represent genuine structural vulnerabilities. The honest answer is that both perspectives carry merit, and the outcome will depend on factors — earnings delivery, interest rates, regulatory environment, and geopolitical developments — that remain uncertain.
How to Reduce Portfolio Concentration Risk: Practical Considerations
Investors exploring ways to manage concentration risk may consider a range of approaches — from broadening equity exposure to revisiting asset class allocations — though each strategy involves trade-offs that depend on individual circumstances, time horizons, and risk tolerance.
Key Steps Some Investors and Advisors Discuss
First, understanding your actual exposure is a reasonable starting point. Investors holding multiple U.S. equity funds — growth funds, large-cap funds, and S&P 500 index funds simultaneously — may find they have more overlapping mega-cap exposure than their fund count implies. Portfolio analysis tools and financial advisors may help surface this “hidden concentration.”
Second, some investors review their allocation to non-U.S. equities, small-cap equities, or alternative asset classes as potential diversifiers. The Russell 1000 Growth index, for context, had its top 10 holdings at over 60% of total weight according to Lord Abbett’s February 2026 research — suggesting that growth-oriented strategies may carry even higher concentration than the S&P 500 itself.
Third, rebalancing discipline — systematically trimming positions that have grown to outsized weights and reallocating to underweight areas — is a strategy historically associated with managing drift concentration in portfolios. This does not eliminate risk and may involve tax consequences that should be reviewed with a qualified advisor.
Frequently Asked Questions
S&P 500 concentration risk refers to the degree to which the index’s returns and risk profile are dominated by a small number of large-cap stocks. As of early 2026, the top 10 companies account for roughly 40% of total index weight according to multiple institutional research sources, meaning that poor performance by just a handful of companies could disproportionately affect anyone holding a cap-weighted S&P 500 index fund.
Research from Lord Abbett suggests the Magnificent Seven’s share of S&P 500 earnings growth declined significantly — from 225% in Q4 2023 to 31% by Q3 2025 — indicating that index-level earnings growth has broadened beyond these mega-caps. However, their weight in the index remains very high by historical standards, and the weight-to-earnings gap documented by RBC Wealth Management (41% weight vs. 32% earnings) remains a point of scrutiny.
Cap-weighted passive index funds are required to hold stocks in proportion to their market capitalization. As mega-cap stocks rise in price, their index weight increases, prompting passive funds to buy more of them — which can further support prices and weight, creating what RBC Wealth Management’s research describes as a “passive concentration trap.” This feedback mechanism may amplify concentration beyond what earnings or fundamental analysis alone would justify.
Some investors and advisors explore equal-weight S&P 500 index funds, which give each company an identical allocation regardless of size; international developed and emerging market equity funds; small- and mid-cap equity exposure; and factor-based strategies such as value or low-volatility tilts. Each approach carries distinct risks, costs, and potential trade-offs and should be evaluated in the context of an individual’s overall financial situation with the help of a qualified advisor.
Disclaimer: The information provided in this article is for educational and informational purposes only and should not be construed as professional financial advice. Consult a certified financial planner or advisor before making major changes to your household budget or savings strategy.